To create a crosstab report, go to the Reports page. Click the blue Create button in the upper right corner and select Crosstab.

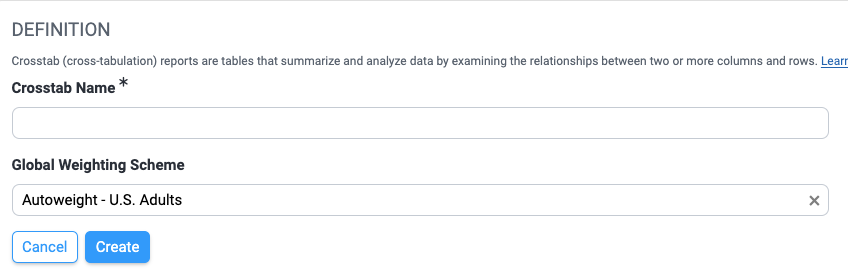
Give your crosstab a name. If you want to use a Global Weighting Scheme, choose it, too. Then click the blue Create button.
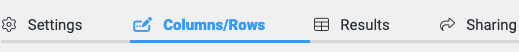
You'll be taken to the Columns/Rows tab.
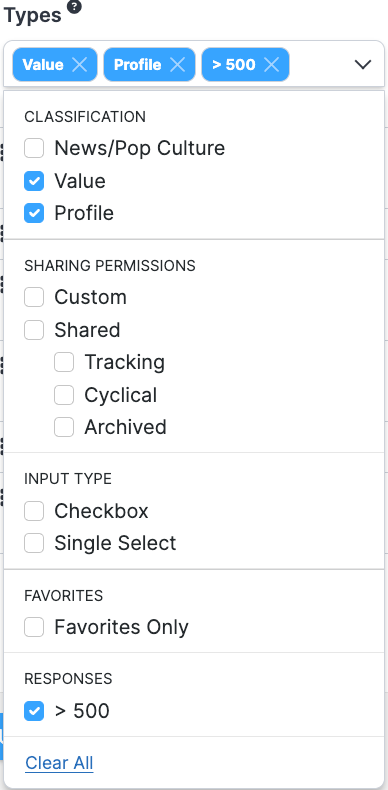
Search for the questions or segments you wish to use as variables. You will need at least one question or segment as a column variable and at least one question. (Segments can only be added to columns.) For questions, you will find the same filters here as you saw on the main questions page. Segments have the same search field as is offered on the main segments page. The results will be sorted by most responses first. All radio and checkbox questions are available.


Please note that the chi-square test cannot be performed if the expected frequency for any table cell is less than one or if more than 20% of the cells have an expected frequency of less than five.
Drag and drop the questions/segments to the column and row sections. You may also drag and drop questions/segments from the row area to the column section and vice versa. If a variable's results must be filtered by date, it must be added as a column.
Add as many variables as needed.

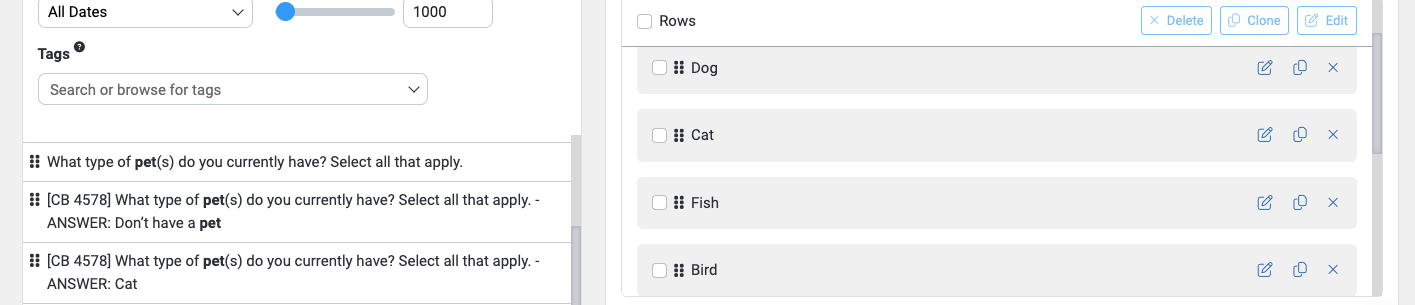
If you choose the overview question for a checkbox group, all of the checkbox group's answers will be added to your variables. Here, I selected What type of pet(s) do you currently have? Select all that apply. When I dragged it over to my Rows area, all nine of the checkbox group's answers were placed in Rows.
If you add a question that has yes/no answer options, the system selects only the yes answer by default.
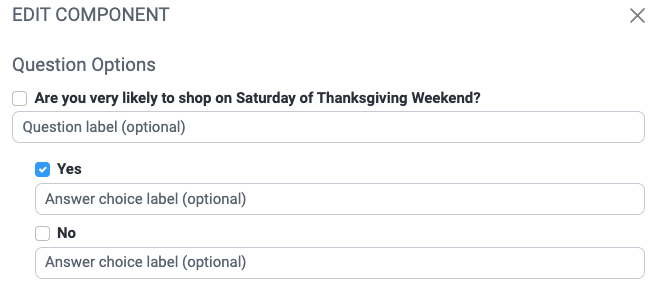
Each row and column variable can be edited using the first icon, which looks like a pencil poised over a piece of paper.

You can provide custom labels for the question text and each answer choice. These labels are optional. You may choose which answer choices you want to include or select an Answer Grouping (if an answer grouping exists for that question). This is also where you would apply a Segment filter.

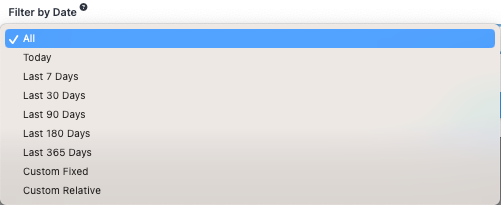
When editing the column variables, you may also Filter By Date.
Use the blue Submit button to apply any changes.
If you edit a segment you've added, you can add a custom label for the segment and filter it by date (if its' in the columns area). Media partners can also add a network filter.

 To clone a row or column, use the second icon, which looks like two pieces of paper. To remove a variable, click on the small X on the right side of the variable row.

To move a variable, click on the vertical grip icon on the left side of the variable row, then drag the variable to a new position. When you hover over the icon, your mouse pointer will change to a hand.
The checkbox field to the left of the Columns or Rows title can be used to select all variables. Selected variables may then be deleted or cloned.
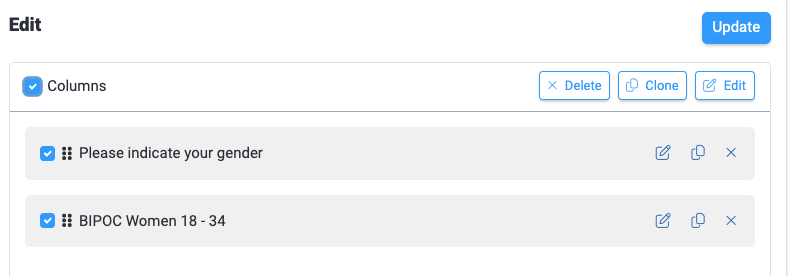
When the variables are arranged to your satisfaction, use the blue Update button in the upper right corner of the page.
After hitting Update, you'll see this message.
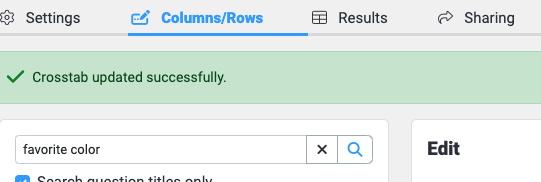
Go to the Results tab to see your report. Use the checkboxes at the upper left to enable or disable the row percentages, column percentages, and percentages from expected.

In the bottom left corner of the crosstab, you'll see the total number of responses, the statistical significance of the association between the variables, the p-value, the strength of association, and the T coefficient. If you want more detail on the meaning of those items, please see this article.

We also have a step-by-step video showing the crosstab creation process.