Question insights are differences in traits, attitudes, and behaviors associated with the answers to your question. Insights are ranked by strength, a measure that combines the effect size and confidence level of the association.
Question insights are a quick way to discover how different respondents answered a question. When insights are calculated, the InsightStore automatically looks for statistically meaningful differences in how pre-selected segments of respondents answered the question and presents these differences to the user. Automatically calculating and summarizing this for the user makes finding relevant information about the question much easier and quicker.
Insights calculation considers the question filters, answer groupings, and weighting schemes applied when the insights are calculated.
Calculating insights is a computationally intensive task, so it is performed asynchronously.
Insights the InsightStore Discovers
The InsightStore compares respondents of each answer in the question against the respondents of other answers for a set of traits, attitudes, and behaviors.
It is essential to note that even though the system looks for many insights, it will only report on those discovered – i.e. when the comparison yields a significant difference. If a question has few responses, or if the respondents for each option don’t respond differently to the traits, fewer (or no) insights will be discovered.
For instance, let us consider the question What is your favorite color? The answers are Blue, Red, and Yellow. The system will look for how people who responded blue differ from those who responded not blue (i.e., red or yellow). The system will also do the same for people who responded red (against those who responded blue or yellow) or yellow (against those who responded blue or red).
The traits are divided into basic and topical. The basic characteristics the system compares against are age, gender, income, education, urbanicity, parental status, U.S. geographic region, and period. The topical traits are brands, current events, demographics & profile, entertainment, food & beverage, health & wellness, lifestyle, media consumption, personal finance, politics & ideology, shopping habits & behavior, and technology usage.
One example of an insight would be to verify if the respondents who answered blue are different from those who answered yellow or red according to gender (one of the traits). So, if those who answered blue are 50% women and those who answered yellow and red are 25% women, the system would indicate that women are twice as likely to respond blue.
The system will also look for insights in the reverse direction, i.e., how the traits differ concerning the answers to the selected question.
Calculating Question Insights
Question Insights are available in the question results submenu. To reach them, click on the text of any question, then go to Results > Insights.
The insights page will always show the results of the most recent computation of Insights with the selected filters and weighting scheme.
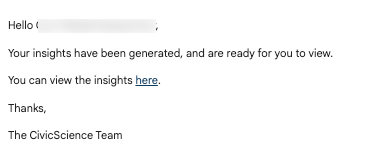
If insights with the currently selected filters and weighting scheme have not yet been computed, the system will display the message below to indicate as much.

Clicking on that link will trigger the background process that computes the question’s Insights. The background process can take seconds or minutes, depending on the question selected and the number of respondents. Once the computation is finished, you will receive an email notifying you of such with a link to view the results. When the email is received, you may click on the link.
Understanding the Insights
Insights are shown in a list. The list contains all insights that were discovered.
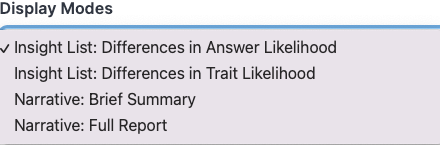
For ease of navigation, there are a display modes dropdown and a filter options dropdown just above the list.
The display modes supported are Insight List: Differences in Answer Likelihood, Insight List: Differences in Trait Likelihood, Narrative: Brief Summary, and Narrative: Full Report.
The Filter Options are divided into four sections: All Insights, Basics, Answers, and Topics. Basics include Gender, Age, Income, Education, Urbanicity, Parental Status, and Geography.
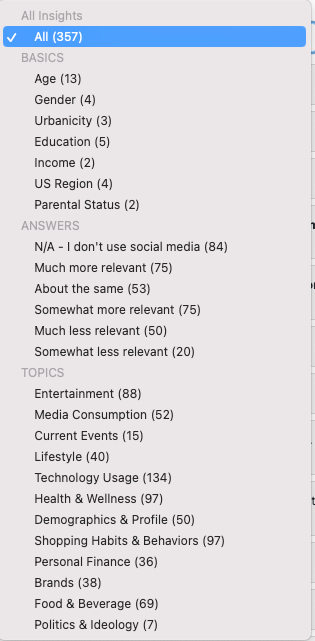
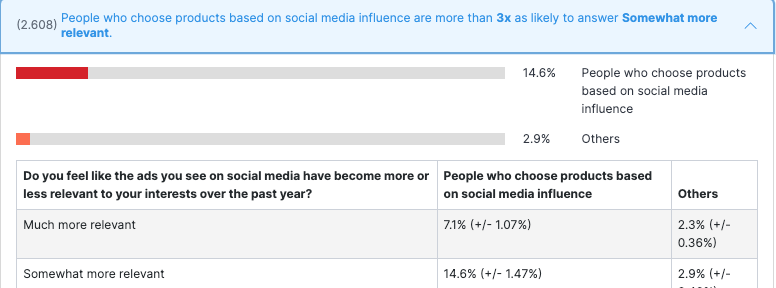
Answers are the various answer options for the question. Each answer option in the selected question (with the selected filters and weighting scheme) is tested to see if there are any statistically significant differences between how respondents of that answer option responded to the question when compared to respondents that picked any of the other answer options. For the question, “Do you feel like the ads you see on social media have become more or less relevant to your interests over the past year?” one of the discovered insights is that people who choose clothing based on social media influence are more than four times as likely to answer “Somewhat more relevant.”

Topics are the subjects into which the questions with statistically significant correlations fall. They will vary for each question.
Here’s a (partial) example of a list of insights:

Understanding the Insights Results in Narrative Mode
When the brief summary or full report is selected, the system will use natural language generation (NLG) to produce an English-language text describing the results and insights discovered. The text is hyperlinked to each of the insights, so you can explore each in more detail if you so choose.
These reports are compelling but very simple, as the analyses are performed for you. You can add the generated summary text to a dashboard, or you can copy and paste the sections that are relevant to you into any text editor.
The brief summary includes a description of the question results and some basic insights with the highest strengths.
The full report will include all insights discovered, which can become long when many insights are present.
Here’s an example of a brief summary:

Insight Details
You will see an insight’s details if you click on the expanding caret to the right.