Once you've added data to your dashboard, you can modify it in several ways.
If you wish to reorder your dashlets, hover over a dashlet until the cursor changes, then drag the dashlet to a new location on the page.
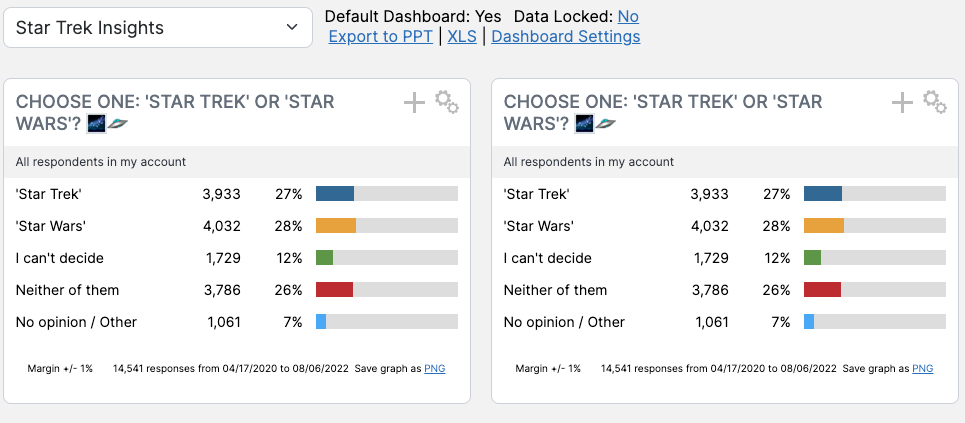
I've added one question twice, so it appears as two dashlets next to each other.
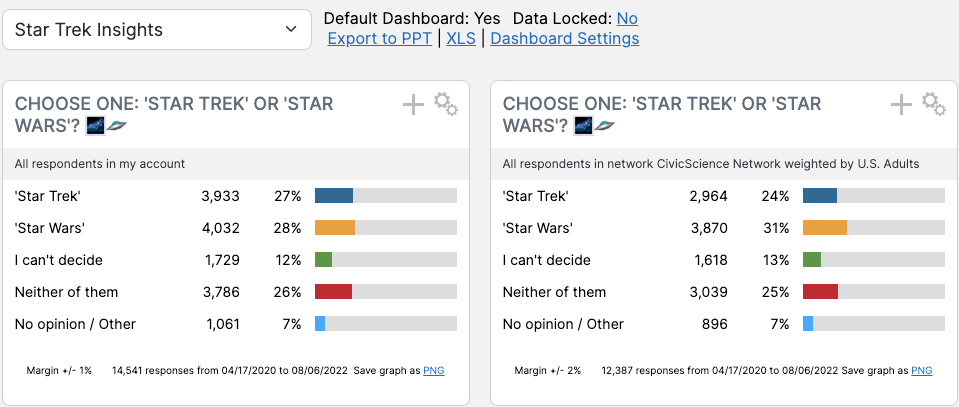
Now, I'm going to click on the gear symbol at the upper right of the dashlet in the right column. It expands to show these options.

The dashlet can be given a new name by entering any value in the Dashlet Name field. The question whose results are shown in the dashlet can be changed by entering a new question ID in the Question field. The type of chart displayed may be changed in the Chart Display Mode field. If you want to see results for all respondents instead of just those in your own network, you go to Select a Network and choose 11 CivicScience. You can filter results by segment, target, or date in the Filter by Segment, Filter by Target, or Filter by Date fields. If you'd like to weight the results, you may use the Weight by field.
Here I've weighted the results on the right by the U.S. Adults weighting scheme.