The library of questions in CivicScience’s InsightStore is the foundation of all the data we collect and analyze. We use questions to gather information from voluntary respondents. Questions are asked through a network of websites (each a media partner) and on CivicScience's carousel site. Voluntary and anonymous responses are continuously collected and stored in CivicScience's database. The answers are available for aggregate reporting and analysis through CivicScience's InsightStore platform. Questions are the fundamental unit of research in the CivicScience environment. The CivicScience question library contains about 50,000 questions on thousands of topics.
On media partners' websites, questions are asked through instances of the poll unit. The questions on each instance are configurable and generally presented in groups of three to website visitors called respondents. Once the series is answered, the results are presented to respondents, so they can see how their answers compare to what others think.
To access the questions list, click on questions in the top navigation bar.

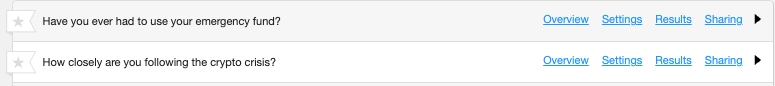
You can search for questions, filter or sort the list of questions in many ways, mark questions as favorites, or access the individual question pages by clicking on the Overview link to the right of the question's text.
Questions fall into three categories and two ownership types.
To see the question's results, click on Results or use the black arrow to the right of the question in which you are interested.
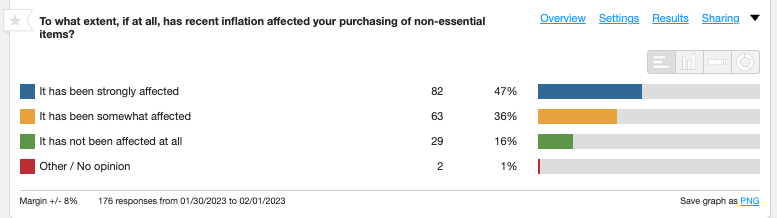
Here, I used the black arrow. The question has expanded to show its results in brief. The summary shows the text of the question as asked and each of the question responses, along with the response counts and a chart showing the share of each response. Along the bottom, you can see the margin of error, the total number of responses received in this account, and the dates on which the poll has been live (gathering responses). (This particular question is live now.) There's also a link you can use to save the results as a PNG file.
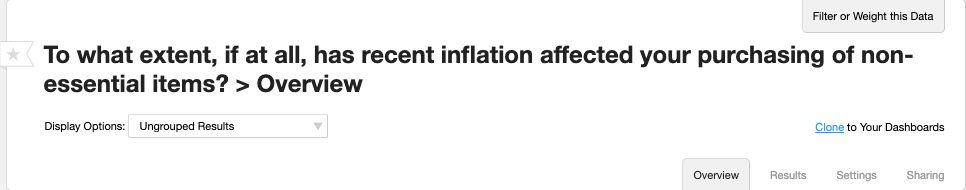
To see a fuller view, use the Overview link along the top edge of the question display. That will show you the question's wording, a Display Options dropdown, a link you can use to Clone the question to a dashboard, a tab where you can Filter or Weight this Data, and the Overview, Results, Settings, and Sharing tabs.
Below that are smaller units that show Results, Insights, Networks, Compare Suggestions, Timeview, Targets, Statistics, and various Profile categories (Gender, Race, Education, Parental Status, Age, Income, and Urbanicity).
The Results are the same as those we saw above. If we wanted to know more, we would use the View Details link.

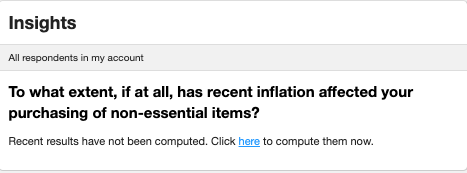
Insights have not yet been computed for this category. I want to see them, so I click on the here link to have them computed. The system calculates them asynchronously and sends me an email when the process has finished.
Here are the results of the computation. The stronger the strength of a correlation, the darker the green label on the left.

Next, we have Networks. This is a convenient comparison of the way respondents in My Account, the Benchmark Network, and the CivicScience Network responded. There are also My Cluster, My Publisher Type, and My Region, which are no longer used.

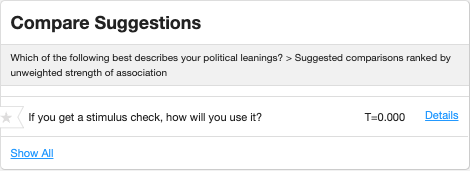
Next is Compare Suggestions. These would be questions that have interesting results when compared with this question. There is only one suggestion for this particular question so far. We'll look into that in more detail in another article.
Timeview would normally show us a choice of displaying the yearly, monthly, weekly, or daily results. This account is very new, so we're only seeing the results for this week.
This publisher partner has four targets, only one of which is live at the moment, so My Overall Results matches the results for the In Article Ghost target.

As you can see, the Statistics block has two different types of information. The first is about the number of respondents in this particular account. The account is only a few days old, so the graph starts on 29 January. The second is statistics for the question itself. It was launched on 4 December 2014 and was last answered today, 2 February 2023.
