The library of questions in CivicScience’s InsightStore is the foundation of all the data we collect and analyze. We use questions to gather information from voluntary respondents. Questions are asked through a network of websites (owned by our media partners) and on CivicScience's user site. Anonymous responses are continuously collected and stored in CivicScience's database. The answers are available for aggregate reporting and analysis through CivicScience's InsightStore platform. The CivicScience question library contains about 50,000 questions on thousands of topics.
Questions are asked through instances of our poll unit. The questions on each instance are configurable and generally presented in groups of three or four to website visitors, who are called respondents. Once the series is answered, the results are presented to the respondents, so they can see how their answers compare to what others think.
Questions fall into three classifications and two sharing permission types. There are also multiple question styles.
 To access the questions list, click on Questions in the left navigation bar.
You can search for questions, filter or sort the list of questions in many ways, mark questions as favorites, or access an individual question's details page by clicking on the question's text.
To see the results of most1 questions, select the blue expanding caret to the right of the question in which you are interested.

The question will expand to the results. The question results contain the text of the question as asked and each of the question responses, along with the response counts and a chart showing the share of each response.
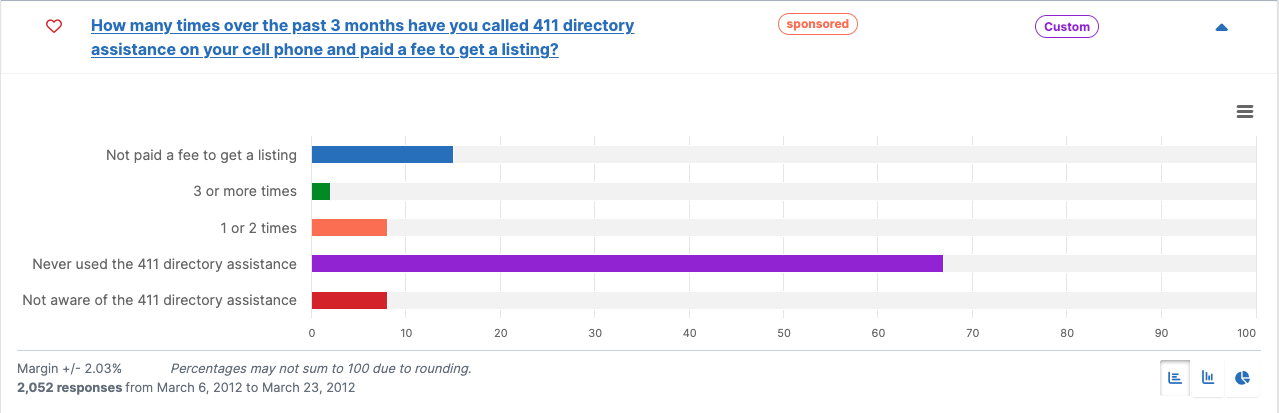
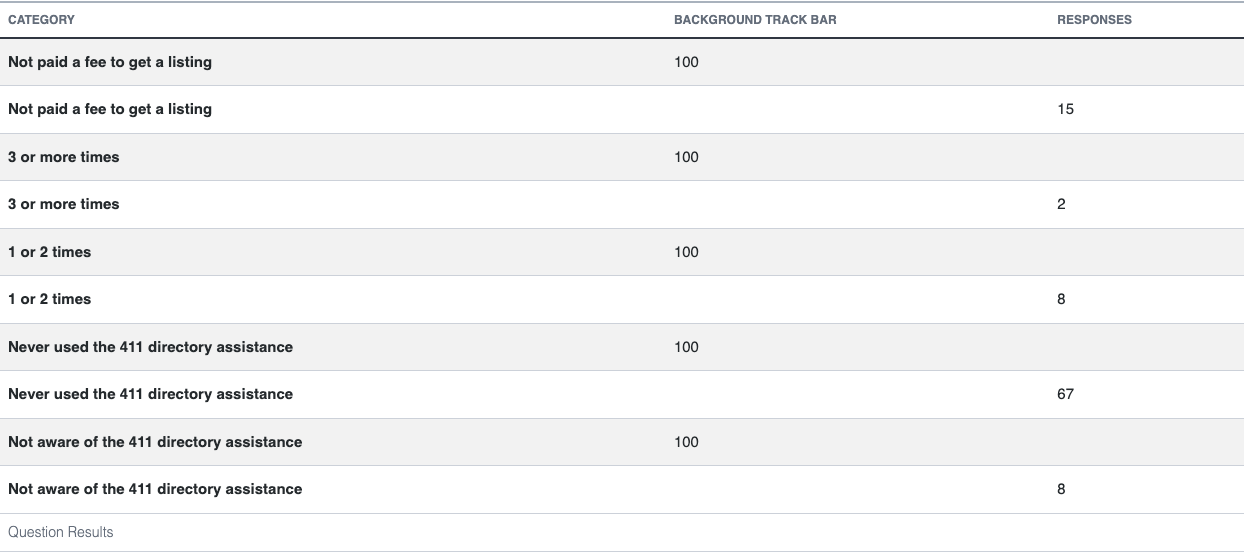
Results are displayed as a horizontal bar chart by default, but you can use the buttons at the lower right to switch to a vertical bar chart or a donut pie chart. The margin of error, number of responses, and date range during which those responses were gathered are shown in the lower left. If you wish to print or export the results, click on the hamburger menu to the right, above the chart. You can download the chart in PNG, JPEG, PDF, or SVG formats or download the data as a CSV or XLS file. You can also view the data table.
To see more information about a question, click on its text from the questions list to go to the question details page.
1Checkbox and matrix questions' results aren't displayed in this manner.