Scorecards have been replaced with crosstab reports, and scorecards cannot be created or edited in InsightStore 2. However, scorecards created in InsightStore 1 can be viewed and downloaded in IS2.
Go to the Reports item in the left navigation bar. If there are many reports in your account, you may find it convenient to select Scorecards Only in the Report Type filter.
When you open a scorecard, please give the system a moment to load the data. It will then show you something like the image below. This scorecard has another column that doesn’t fit on the page, as indicated by the bright blue greater-than sign (see the purple arrow below).

Each column of a scorecard is a segment, and each row is an answer to a question.
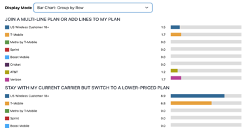
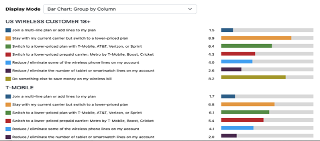
After the scorecard’s data has been loaded, you can choose to view the scorecard in one of three ways: as a Scorecard Table (see example above), as a Bar Chart: Group by Column:
Or as a Bar Chart: Group by Row.