To create a multitimeview report, click on the blue Create button and select MultiTimeview.
The MultiTimeview Name is required. Provide a name that will be meaningful to all members of your organization's account.

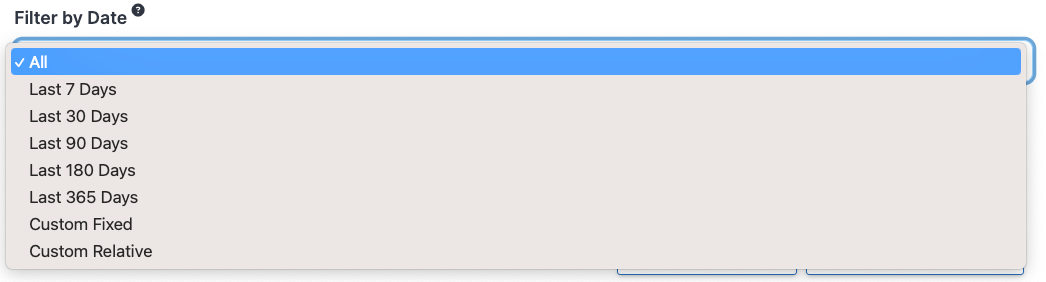
If you do not select a date filter, the setting defaults to All dates. You may choose from five relative date settings and two custom settings.
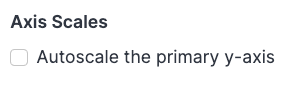
Check the Autoscale the primary y-axis box if you don't need the graph to go all the way to 100. Doing so can eliminate excess blank space on your graph. This setting may be changed later if you aren't happy with the scale of the graph.
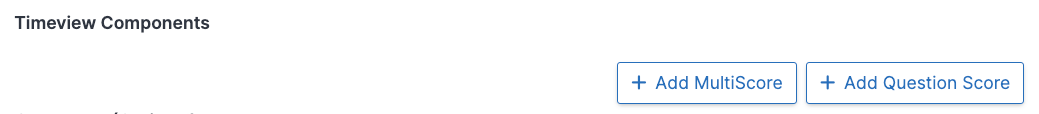
At least one Timeview Component is required. You may select multiple multiscore reports and/or question scores, too.
Comments are optional but we suggest that you use them to describe the purpose of your report. The comments aren't shown on the report itself but may be viewed in the report's settings.
If you've changed your mind about creating the report, use the Cancel button. If you want to clear the Create MultiTimeview form and start fresh, use the Reset button. To create your report, use the blue Submit button.

After the report is created, you will be taken to the report's Settings > Definition page. Here you may change any setting if you wish to do so. If you make any changes, use the blue Update button to have them take effect.
The six dots to the left of the Timeview Component label can be used to reposition the component, as can the up and down arrows to the right of the Edit button.

Use the Edit button to filter a component or apply a weighting scheme to it. You can also choose to put this particular score on its own Separate Axis, which is useful when including a Total Response Count with a score. If Separate Axis is selected, you can also Autoscale the separate axis to eliminate excess blank space on your graph.

To see your report, go to the Results tab.

Use the Add to Dashboard link in the lower right corner to add the report to a dashboard.