To export the data from a crosstab report, use the export button in the upper right corner of the report.

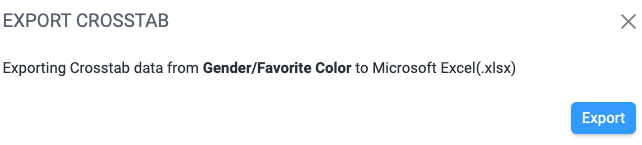
You'll be presented with this modal:
When you click the blue Export button, your file will download. The file will be named crosstab name time date.xls. For my Gender/Favorite Color crosstab report, the export file is named Gender_Favorite Color 15_05_17 21-11-2023.xls. (The time is in UTC.)
The exported file will contain several tabs.
The first tab, Settings, shows basic information about the crosstab report including:
- title
- time and date the report was generated
- username of the user who generated the report
- URL for the report
- weighting scheme (if any)
- questions in the rows, with filter segment and date range
- questions in the columns, with filter segment and date range
- number of responses
- significance (Χ2 with df)
- p-value
- strength of association (T-coefficient)

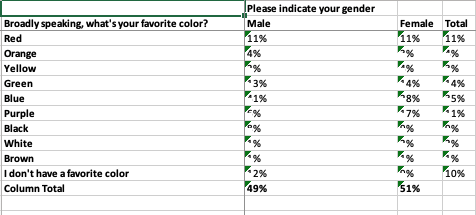
The second tab, All Results, shows the same information found on the Results tab of the crosstab report.

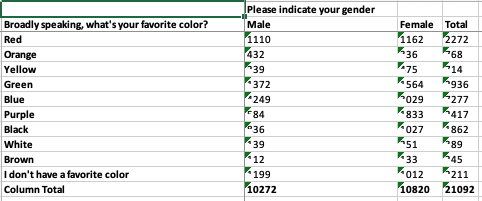
The third tab, Responses, shows the number of responses for each category.
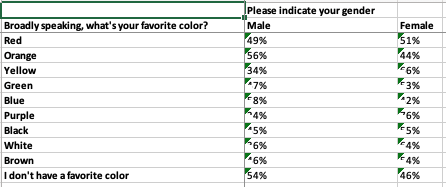
The fourth tab, Row %, shows the row percentage values and their totals.
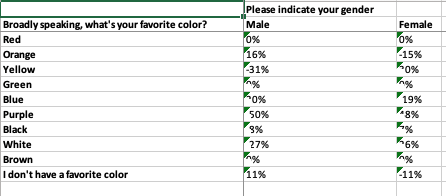
The fifth tab, Col %, shows the column percentage values and their totals.
The sixth tab, % From Expected, shows the differences between the expected and actual results.