A dashboard is a collection of user-configured dashlets, which are pieces of information or data.
Users may create, configure, and share as many dashboards as they like. They may be organized by topic, project, or any other characteristic.
There are currently five types of dashlets that can be added to a dashboard:
- Comments – users can leave a comment on the dashboard, which will be visible to anyone who has permission to view the dashboard
- Communications – an area for important messages from CivicScience
- Data Views – user-configured views of the data for a question, reflecting any filters or weighting applied[1]
- Notifications – notices of new questions in your account or other updates
- Question Lists – the results of user-configured question searches
You may also use dashboards:
- as a workspace (private or collaborative) in which to gather and experiment with various data visualizations
- to look at a side-by-side comparison of different segmentations of the same questions and data sets
- to organize ideas into a compelling story
- to share ideas and deliverables
Navigating to a Dashboard
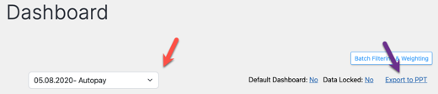
To find a specific dashboard, click on the dropdown box (red arrow) and look through the list of dashboards to which you have access. Dashboards are listed numerically, then alphabetically.
Default Dashboard
Click on the word No next to Default Dashboard to set the current dashboard as the default. The default dashboard is the one displayed when initially loading the Dashboard section.
Data Locked
If Data Locked is set to Yes, the data is frozen when it is locked. So, if the data is locked on September 1, 2022, the dashboard will reflect only responses received up to that date.
Exporting a Dashboard
To export an entire dashboard, select Export to PPT (purple arrow above) to create a PowerPoint file. Please be aware that the PowerPoint file may require significant formatting.
Batch Filtering & Weighting
You will see a Batch Filtering & Weighting button at the upper right corner of some dashboards. It will allow you to apply filters or weighting schemes to all the dashlets in a dashboard with one operation.

This video goes over dashboard basics.
This video covers building out dashboards.
[1] These must be added to dashboards by an account manager