The Profile section shows the question's answers broken down into several categories:
- Gender
- Age
- Race
- Income
- Education
- Urbanicity
- Parental Status
To reach the profile, find the question you're interested in and click on its text to reach the question page. Go down the page to the Results heading and click on Profile.
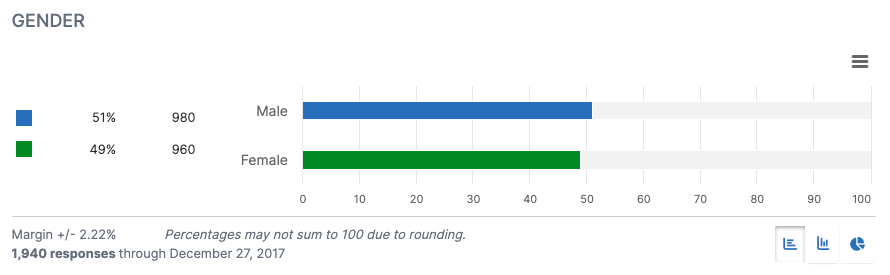
Under each demographic section, you will see a horizontal bar graph.
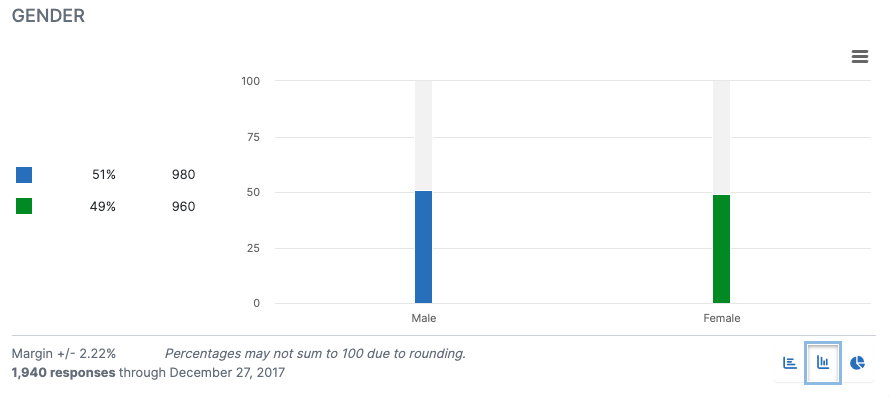
If you prefer other chart styles, you may use the three buttons at the lower right on each demographic section to switch the view to a vertical bar graph:
Or a pie chart:

The hamburger menu at the upper right may be used to access each chart's download/export options or switch to the data table view.
